Analytics overview and usage
Analytics shows how your knowledge base is performing: what people ask, how confidently it answers, which documents pull their weight, and where the gaps are. Open it from the sidebar — it has five tabs:
| Tab | Question it answers |
|---|---|
| Usage | How much is the system being used? |
| Query Logs | What exactly has been asked, and how was it answered? |
| Document Performance | Which documents are doing the answering? |
| Gap Analysis | What couldn't we answer? |
| Audit Log | Who changed what, and when? |
The Usage tab
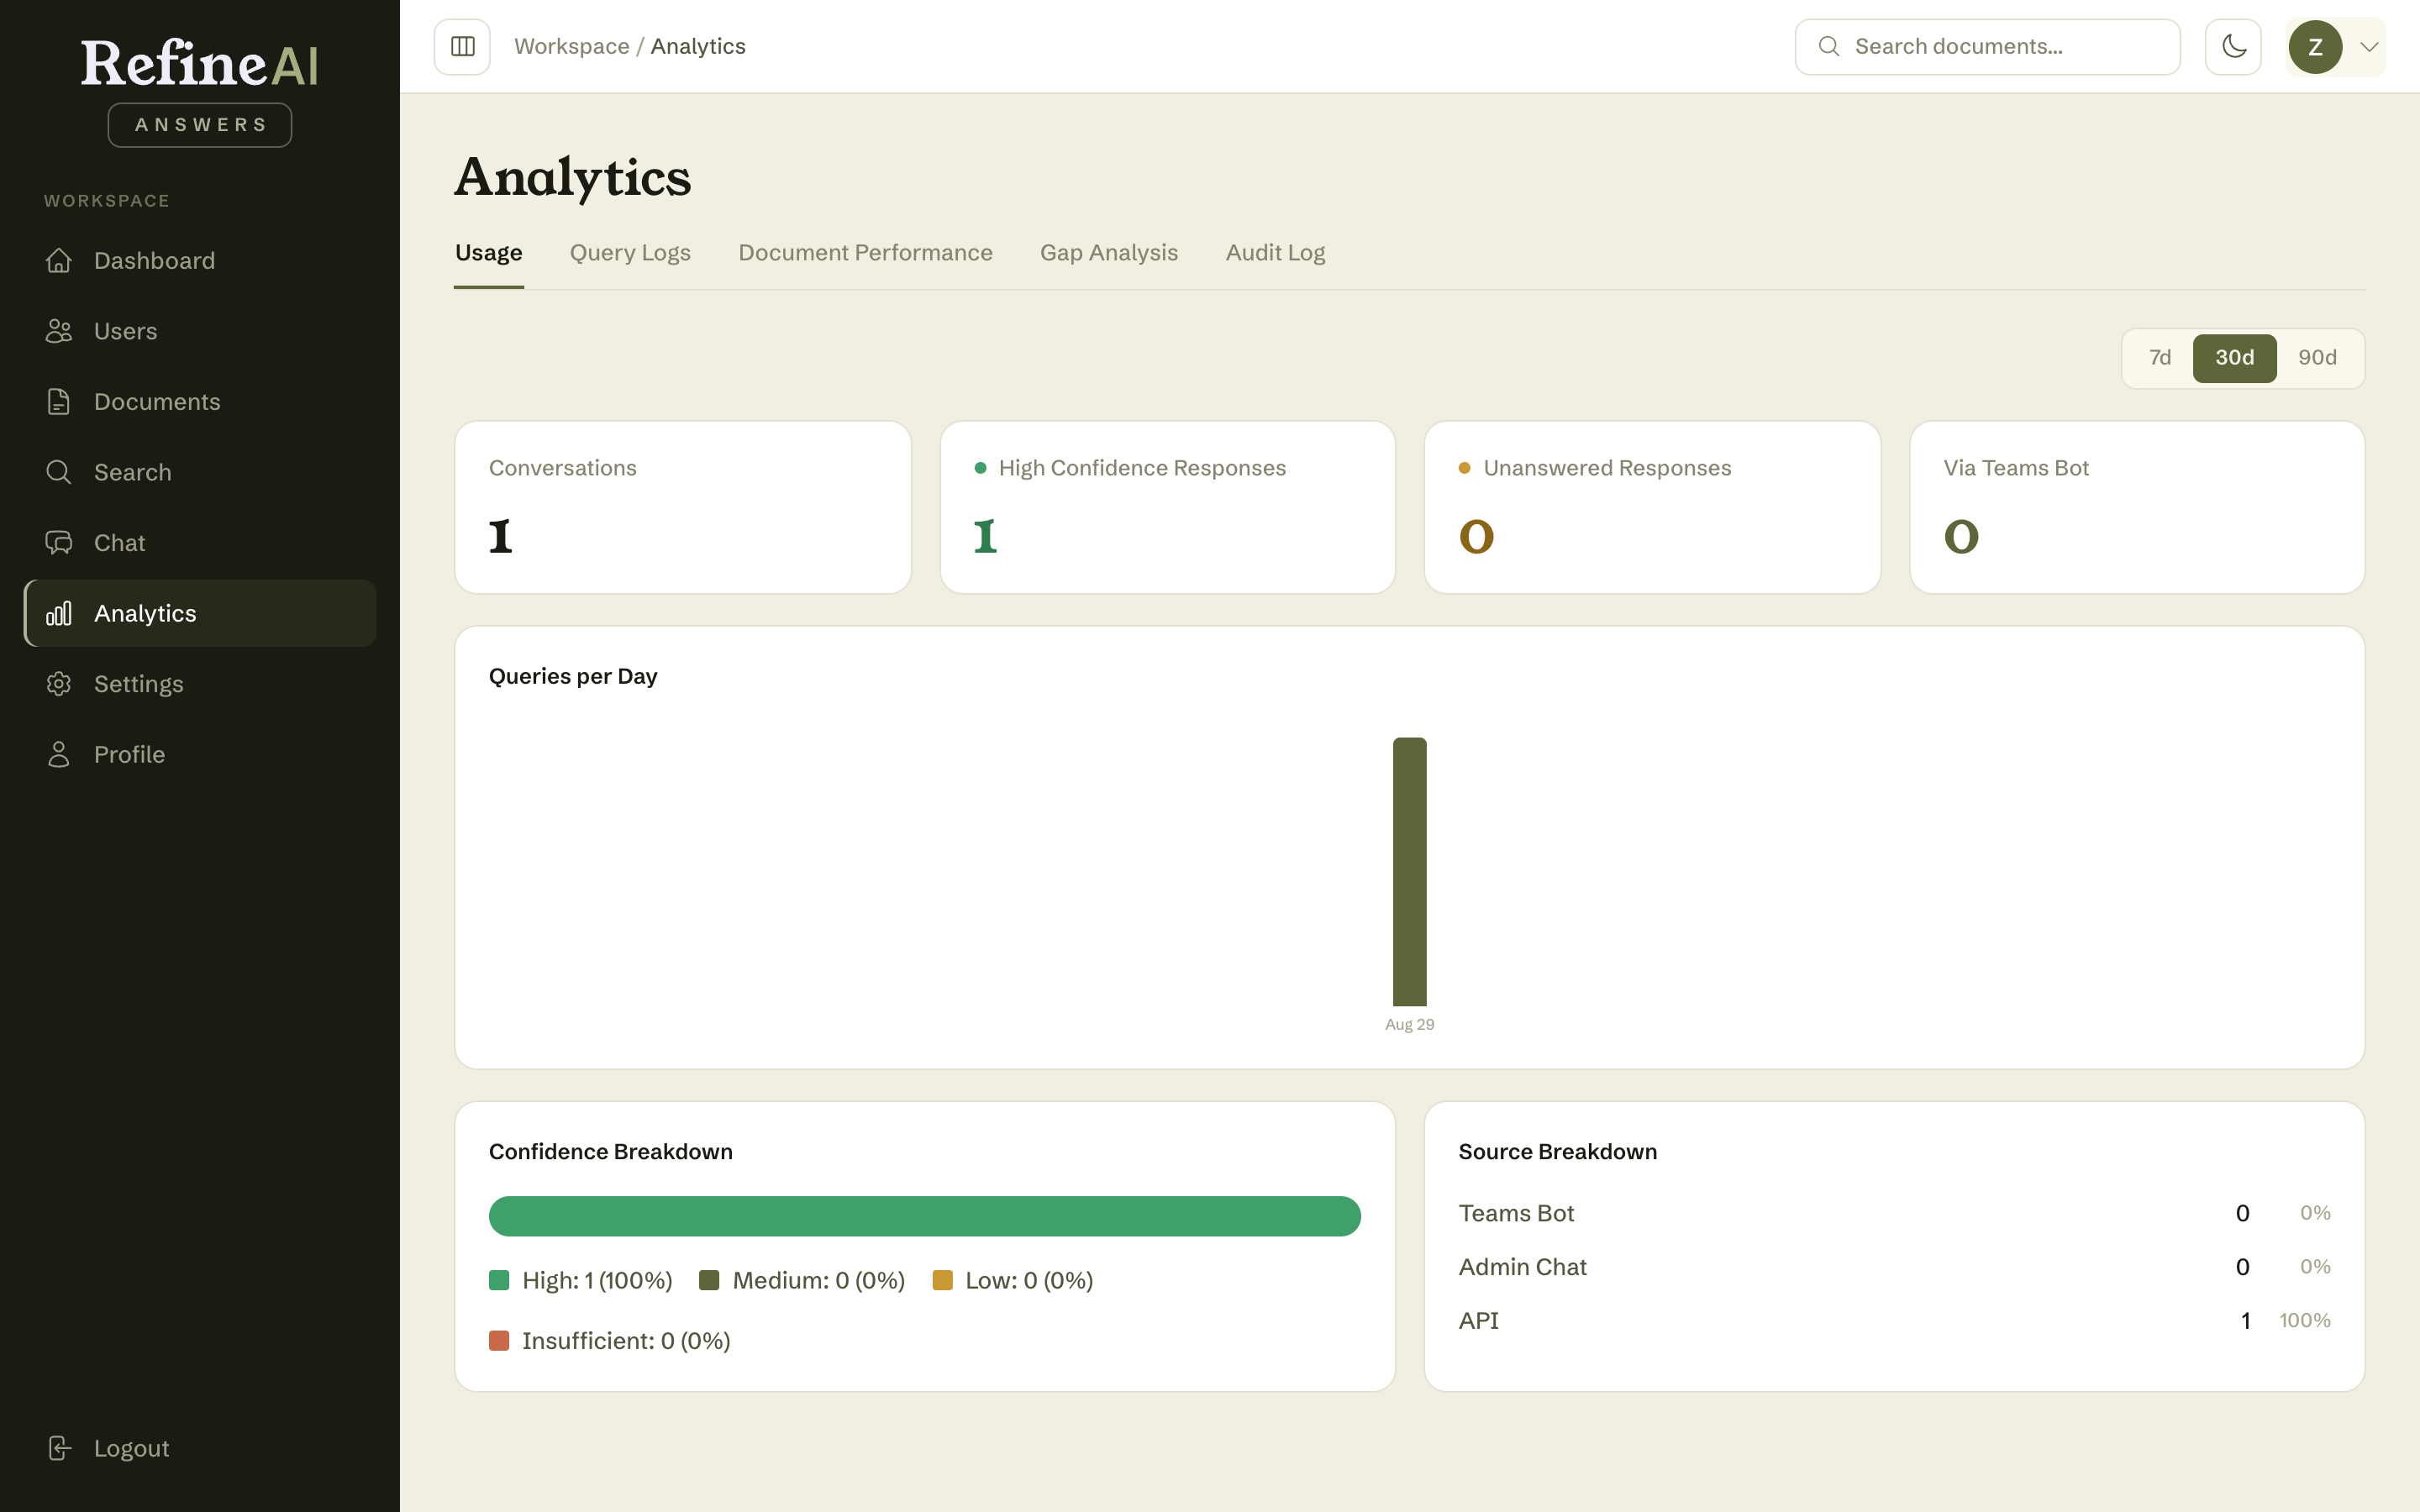
Usage tracks the headline numbers over time:
- API calls this month, with the historical trend,
- Document count as your library grows,
- Query volume, switchable between 7 / 30 / 90-day windows,
- summary cards: total documents indexed, queries in the last 30 days, average queries per day, and unique users asking.
How to read it: rising query volume with steady document count is fine; rising unanswered volume (check Gap Analysis) means the library needs feeding. API call figures also count towards your plan's monthly allowance, visible in Organisation settings.
Next: Query logs →